Note: According to the latest research A Deeper Look into the Spawner Split with more precise modeling, Blaze bedding is a ~20.54s time save on open spawner and ~19.54s time save on closed spawner.
Conclusion: Blaze bedding is a ~23.3s time save on average on an open spawner or a ~19.8s time save on average on a closed spawner. Zero cycling however has a much higher skill ceiling, and is different in ranked than rsg since the dragon flies away much less and ranked has max perch. For ranked, one who can make open front t100 y104 49% of the time and open back m85 y95 84% of the time and mess up badly 14.6% is estimated to save 23.3s saving explosive for a 5 explosive zero; rsg however is much more complicated not only because dragon flies more, max perch doesn’t exist but also nerves may fail more zeroes on good paces than normal, and you would probably like to high roll more than a 3 minute perch. Average also doesn’t cover how cases like entering the spawner with 2 rods, being 30s behind in a ranked game, willing to high roll for top however many% results to save pace may affect the decision, so more research is definitely needed.
Crazy story but this is also something I’ve been thinking about for a while. The question can be split into two parts, how much time does blaze bedding save and how much time does zero cycling save, and I am going to dive into them seperately.
How Much Time Does Blaze Bedding Save?
Properly analysing the spawner split was only made possible to me this week by the release of Mescht’s Blaze Practice Map. Just doing many spawner split in a row has the risk of introducing so much noise, like how fast you kill the blaze, how long the gap between spawns are, how fast you clear the fire out, how overlapped your pre-craft and portal build splits are. Having direct access to an approximation of the probability of blazes spawning at any moment makes it so much cleaner and I was able to only gather much less data and put it into a computer simulation to get a relatively accurate result, and get a much higher level insight.
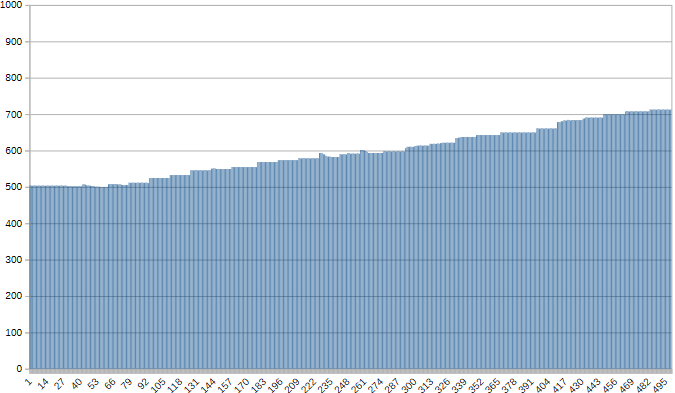
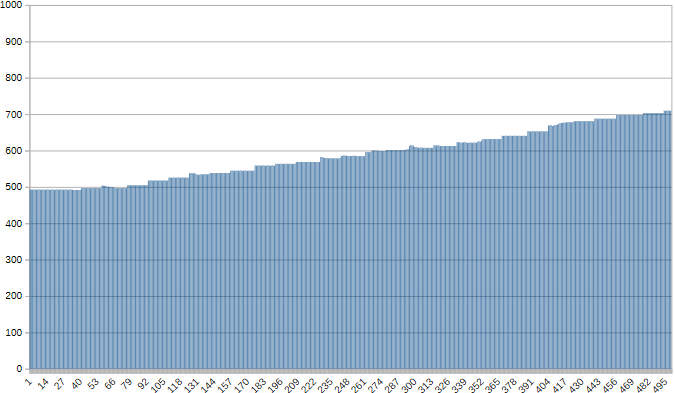
Specifically, I made a command block that logs each tick the avalible spawn % after each blaze split started. Then I turn off blazes spawning and do blaze bed and clear fire&blocks / mine out the spawner as fast as I could. This takes away all the noise except fire rng and the brain rng of me clearing the spawner. So I did 40 open spawner blaze bed, 59 closed spawner blaze bed, and mined out the spawner 1 time each for open and closed spawner, and took the average. the results are as follows:
open spawner, single blaze bed:
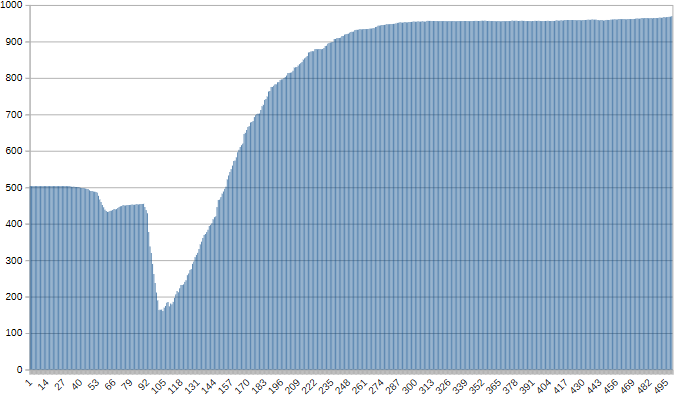
open spawner, mine out with iron pick:
closed spawner, single blaze bed:
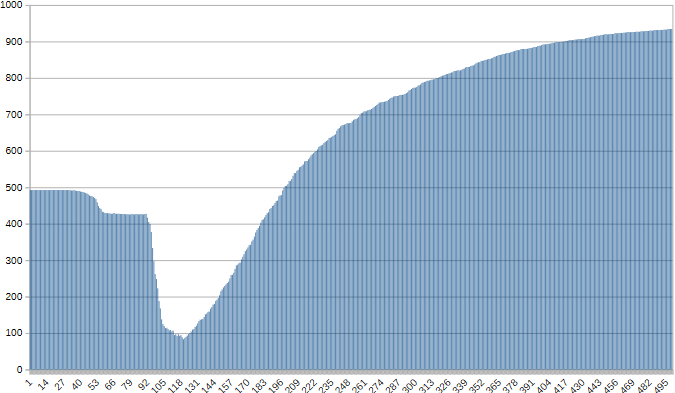
closed spawner, mine out with iron pick:
Then I wrote a little bit of code to simulate 100 million blaze splits each:
#include<bits/stdc++.h>
using namespace std;

double a[505];
inline double gc(int x)
{
	if(x < 498)return a[x];
	else return a[498];
}

map<int, int> m;
mt19937 seeder(12345), rng(12345);

uniform_real_distribution<double> rdis(0.0, 1.0);
inline bool p(double x){ return x > rdis(rng); }

inline int sim()
{
	const int res[2] = {6, 7};
	uniform_int_distribution<int> tdis(200, 799);
	int rod = res[p(0.2)], t = 20, ret = 20;
	while(rod > 0)
	{
		double cur = gc(t);
		int spawned = 0;
		while(!spawned)
		{
			for(int i = 0; i < 4; i++)
			{
				if(p(cur))
				{
					cur *= 0.9722122525247163;
					spawned++;
					if(p(0.5))rod--;
					if(rod == 0)break;
				}
			}
		}

		if(rod <= 0)
		{
			ret += 48 * spawned;
			break;
		}

		int nxt = tdis(rng);
		t += nxt - 48 * spawned;
		ret += nxt;
	}
	return ret + max(0, 300 - max(0, t - 498));
}

int main()
{
	ifstream fin("blaze iron pick open extracted.txt");
	ofstream fout("blaze iron pick open times.txt");
	for(int i = 0; i <= 498; i++)
	{
		fin >> a[i];
		a[i] = (a[i] / 1000) * 0.9136;
	}

	for(int i = 0; i < 100000000; i++)m[sim()]++;

	double ans = 0;
	for(int i = 0; i < 15000; i++)
	{
		fout << m[i] << endl;
		ans += (double)i * m[i] / 100000000;
	}
	cout << ans << endl;

	return 0;
}
The simulation first determine whether the eye breaks or not to decide whether to get another rod, then repeatedly does blaze spawn cycle until the rod count hits. Here I assume that every blaze spawned will take up space to make the next spawn in the same spawn cycle’s probability of spawning multiply itself by 0.97221(it is the best parameter I get from simulating a fully cleaned spawner); I also assume that every blaze takes exactly 48 ticks to kill, and you always prioritize killing blazes than clearing the spawner at any given moment. Note that the time starts at 20 ticks, because the spawner takes 20 ticks to spawn its first batch of blazes. Finally, 15 seconds of overlappable things are done after the spawner is cleared out for 25 seconds and are added to the overall time if they weren’t fully overlapped. The results are as follows:
open spawner, single blaze bed:
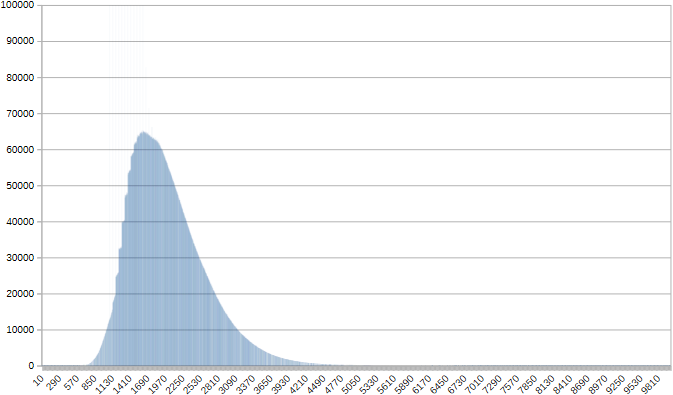
average: 1902.05 ticks or 95.10 seconds
open spawner, mine out with iron pick:
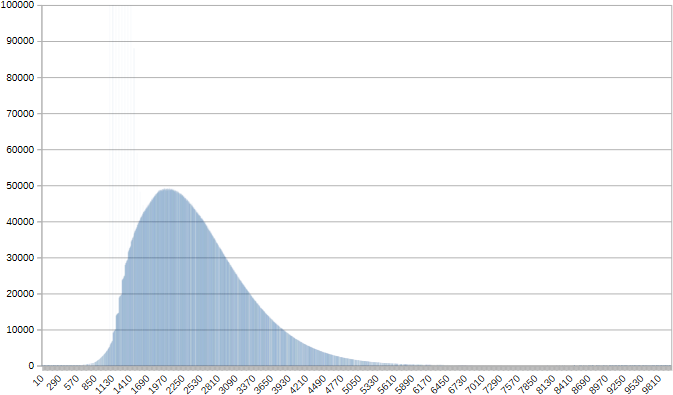
average: 2368.24 ticks or 118.41 seconds
closed spawner, single blaze bed:
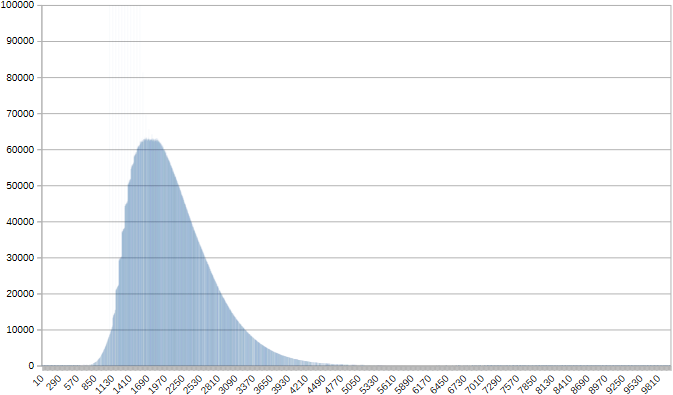
average: 1984.81 ticks or 99.24 seconds
closed spawner, mine out with iron pick:

average: 2381.69 ticks or 119.08 seconds
This means that blaze bedding is a ~23.3s time save on average on an open spawner or ~19.8s time save on average on a closed spawner.
How Much Time Does Zero Cycling Save?
Properly analysing all zero cycle splits is also only made possible now by the allowance time sheet I posted earlier. But even with the sheet in place, there are still problems at hand: how exactly do end spawns distribute and how often exactly does the dragon fly away. I end up finding no good data source and had to do the entire thing myself.
How Do End Spawns Distribute?
Well I gathered 100 end spawns and they look like this:
h0.5  6
h1    3
h1.5  1
h2    3
h3    1
h4    1
h4.5  1
o56   7
o57  11
o58   8
o59   5
p    53
Here, p = open, o denotes a cage spawn with the corrisponding o value, and h denotes that it is an overhang and I think that it loses roughly however amount of time following. This is very little sample size but having to manually gather this information is incredibely boring and this is as much manual labor I personly want to do for now.
How Often Does The Dragon Fly Away?
From what I read, the node is max(73, terrain height + 16) for diagonal nodes and max(73, terrain height + 6) for straight nodes, an additional random 0~20 blocks(in ranked it is 0~15) of y height is added to create the dragon’s target node, and the dragon will satisfy the node whenever it reaches 10 blocks within the target node. The zero cycle setups we know and love today have the bed 4 blocks above the block the player stand on, and the dragon will always be more than about 1 block higher than the bed when a zero cycle is done. This means that the dragon has to be 16+10+(0~20) = 26~46 blocks above ground, so our setup has to be (26~46)-1-4 = 21~41 blocks above ground(in terms of standing block). Normally people just assumes that all end islands have the block directly below the node at a same set y height every time and do calculations from that. I decided to also gather 100 y heights of the block below the node to make this somewhat more accurate.
57   3
58  10
59  14
60  20
61  17
62  20
63   6
64   8
65   0
66   2
plugging in this data, we get:
7/8:

rsg:
 86  0.262
 90  0.462
 95  0.712
 99  0.904
104  0.998

ranked:
 86  0.349333333333333
 90  0.616
 95  0.920666666666667
 99  0.997333333333333
104  1

1/8:

rsg:
 84 0.164
 88 0.55
 92 0.75
 97 1
102 1

ranked:
 84 0.457333333333333
 88 0.733333333333333
 92 1
 97 1
102 1
Important Note: I was not able to find any information whether the random additional 0~20(or the 0~15 for ranked) y height chosen is an integer distribution or a real number distribution. All the results were based on the assumption that it is an integer distribution but the actual result may slightly vary if there shows proof otherwise.
Edit: So I realised I could have just read the code and it turns out that it is in fact a real number distribution and the results changed a bit more than I think, though if anything it made zero cycle a much bigger time save. The results shown above and used for the calculations are already corrected.
Edit 2: @ataraxia pointed out that 1/8 nodes are not exactly 16 blocks above ground level, but max(73, terrain height + 6). The results shown above and used for the calculations are already corrected.
How Many End Islands Can You Zero Cycle On?
Like what I said earlier, this is heavily dependent on the player’s skill level. I assume that the player’s skill level can be measured in the way that:
The player can hit a zero cycle of difficulty x with probability Φ((x - m) / σ), where Φ is the Cumulative Normal Distribution Function. Here m represents that the player can effectively hit a zero of exact difficulty m 50% of the time, and σ represents how much brain rng the player has. If the zero has difficulty lower than x/2, the player would not go for it at all. I also assume that while going for a zero, the player will have a small chance ε of messing up badly, which could mean that the player died, didn’t finish the dragon and have to chasedown, failed the chasedown and have to full bow for 2 perches, etc. The chance of the player messing up is applied before the chance the player hit the zero, meaning if someone has a chance of hitting a zero 50% of the time and badly fail 10% of the time, the player would actually only hit the zero (1-10%)*50%=40% of the time. I assume that when the player mess up like that, the average finish time will be equal to a max perch, which is around 170 seconds subtracting the time the player already spent on failing the zero. But of course in rsg if you die in the end you won’t run it back, so it is kind of cosmetic.
How Much Time Does Zero Cycling Save?
Assuming that the difficulty of a zero cycle is exactly equal to the time allowance it has (removing weird side setups that you can’t really consistently do a 5 explosive zero), plug in the values above, we will be able to calculate the probability of any given player making every single zero cycle, which we can then calculate the probatility of any given player making any zero cycle. And finally, combined with the average time a zero cycle and a one cycle is, we can calculate the time zero cycles save over one cycles.
Now we need to know the average time a zero cycle and a one cycle is. If I restructure my spreadsheet I can calculate the exact average weighted by the probability the player hitting it, but I decided that it is not worth it and for the sake of this I’m just going to assume that all zero cycles costs 50 seconds. For one cycles, I will use Automatt half bow to represent the overall average. I will use the data I got on a ranked instance(1:46.35 average, 20 sample size) for ranked and the T_wagz end fight tutorial(2:05 average) for rsg. This is probably the biggest source of error, but it is still acceptable in my opinion.
With all that being said, here are some examples for how much time a typical player will save on a 5 explosive zero on average:
| ranked 5exp | m=2.5 σ=1.5 | m=3 σ=1.5 | m=3.5 σ=1.8 | m=4 σ=2 | m=4.5 σ=2.3 | m=5 σ=2.5 | m=6 σ=3 | m=7 σ=3.5 | m=8 σ=4 | m=9 σ=4.5 | m=10 σ=5 |
|---|---|---|---|---|---|---|---|---|---|---|---|
| ε=3% | 42.22 | 41.26 | 39.67 | 38.03 | 36.06 | 34.27 | 30.40 | 26.72 | 23.29 | 20.40 | 17.84 |
| ε=4% | 41.26 | 40.32 | 38.77 | 37.17 | 35.24 | 33.49 | 29.71 | 26.11 | 22.76 | 19.93 | 17.43 |
| ε=5% | 40.30 | 39.39 | 37.87 | 36.30 | 34.42 | 32.71 | 29.02 | 25.51 | 22.23 | 19.47 | 17.03 |
| ε=7% | 38.38 | 37.51 | 36.07 | 34.58 | 32.78 | 31.16 | 27.64 | 24.29 | 21.18 | 18.54 | 16.22 |
| ε=10% | 35.51 | 34.70 | 33.37 | 31.99 | 30.33 | 28.82 | 25.57 | 22.47 | 19.59 | 17.15 | 15.00 |
| ε=12.5% | 33.11 | 32.36 | 31.12 | 29.83 | 28.28 | 26.88 | 23.84 | 20.96 | 18.27 | 16.00 | 13.99 |
| ε=15% | 30.71 | 30.02 | 28.86 | 27.67 | 26.23 | 24.93 | 22.12 | 19.44 | 16.95 | 14.84 | 12.98 |
| ε=20% | 25.92 | 25.33 | 24.36 | 23.35 | 22.14 | 21.04 | 18.66 | 16.41 | 14.30 | 12.52 | 10.95 |
| rsg 5exp | m=2.5 σ=1.5 | m=3 σ=1.5 | m=3.5 σ=1.8 | m=4 σ=2 | m=4.5 σ=2.3 | m=5 σ=2.5 | m=6 σ=3 | m=7 σ=3.5 | m=8 σ=4 | m=9 σ=4.5 | m=10 σ=5 |
|---|---|---|---|---|---|---|---|---|---|---|---|
| ε=3% | 47.77 | 46.12 | 43.58 | 41.46 | 38.93 | 36.71 | 32.47 | 28.51 | 24.86 | 21.81 | 19.14 |
| ε=4% | 46.97 | 45.35 | 42.85 | 40.76 | 38.28 | 36.09 | 31.93 | 28.03 | 24.44 | 21.44 | 18.82 |
| ε=5% | 46.17 | 44.57 | 42.12 | 40.07 | 37.62 | 35.47 | 31.38 | 27.55 | 24.03 | 21.07 | 18.50 |
| ε=7% | 44.56 | 43.02 | 40.65 | 38.67 | 36.31 | 34.24 | 30.29 | 26.59 | 23.19 | 20.34 | 17.86 |
| ε=10% | 42.15 | 40.69 | 38.46 | 36.58 | 34.35 | 32.39 | 28.65 | 25.15 | 21.94 | 19.24 | 16.89 |
| ε=12.5% | 40.15 | 38.76 | 36.62 | 34.84 | 32.71 | 30.85 | 27.29 | 23.95 | 20.89 | 18.33 | 16.09 |
| ε=15% | 38.14 | 36.82 | 34.79 | 33.10 | 31.08 | 29.30 | 25.93 | 22.76 | 19.85 | 17.41 | 15.28 |
| ε=20% | 34.12 | 32.94 | 31.13 | 29.61 | 27.81 | 26.22 | 23.20 | 20.36 | 17.76 | 15.58 | 13.67 |
m=2.5 σ=1.5: open back t100 y104 53%; open back 1/8 m85 y97 86%
m=3   σ=1.5: iron pick o58 front m88 y95 50%; open back m91 y99 86%
m=3.5 σ=1.8: open back s76 y95 51%; open back 1/8 t103 y97 83%
m=4   σ=2  : open back 1/8 m85 y97 53%; open front 1/8 t100 y97 86%
m=4.5 σ=2.3: open back m91 y99 52%; open front m91 y99 86%
m=5   σ=2.5: open front t100 y104 49%; open back m85 y95 84%
m=6   σ=3  : open front s76 y95 49%; iron pick o57 front m88 y90 83%
m=7   σ=3.5: open front m91 y99 49%; open front m85 y95 79%
m=8   σ=4  : iron pick o58 front m85 y90 49%; iron pick o55 front s76 y86 84%
m=9   σ=4.5: iron pick o57 front m88 y90 49%; open back m85 y90 85%
m=10  σ=5  : open front tall cage y95 50%; iron pick o55 small cage y86 83%
Important notes:
- The chance of the player messing up is applied before the chance the player hit the zero, meaning if someone has a chance of hitting a zero 50% of the time and badly fail 10% of the time, the player would actually only hit the zero
(1-10%)*50%=40%of the time. This is done because I want to make the fail rate across all players equally impactful, and you can also get this information for a player much easier. - The player would always choose the setup with the best odds of hitting the zero, taking both the player’s skill and dragon’s fly away rng into account.
- The amount of time saved from zero cycling listed here are calculated only with the zero cycles I find consistently hittable with 5 explosives, so it does not apply to broader cases when you have more explosives. I decided that the cut off point is all the offset multiblock setup, including the universal side setups and stuff like back t97 y99, with one exception of back t103 side setups. This cut off is kind of arbitrary, and lower level runners will just know less setups, but there has to be a cut off point and I decided to leave it as is. For future reference, here are the same tables with enough explosives:
| ranked ∞exp | m=2.5 σ=1.5 | m=3 σ=1.5 | m=3.5 σ=1.8 | m=4 σ=2 | m=4.5 σ=2.3 | m=5 σ=2.5 | m=6 σ=3 | m=7 σ=3.5 | m=8 σ=4 | m=9 σ=4.5 | m=10 σ=5 |
|---|---|---|---|---|---|---|---|---|---|---|---|
| ε=3% | 45.49 | 44.60 | 43.01 | 41.54 | 39.76 | 38.03 | 34.18 | 30.19 | 26.45 | 23.19 | 20.40 |
| ε=4% | 44.46 | 43.58 | 42.04 | 40.60 | 38.86 | 37.17 | 33.40 | 29.51 | 25.85 | 22.67 | 19.94 |
| ε=5% | 43.42 | 42.57 | 41.06 | 39.66 | 37.96 | 36.31 | 32.63 | 28.82 | 25.25 | 22.14 | 19.48 |
| ε=7% | 41.36 | 40.55 | 39.11 | 37.77 | 36.15 | 34.58 | 31.07 | 27.45 | 24.05 | 21.09 | 18.55 |
| ε=10% | 38.26 | 37.51 | 36.18 | 34.94 | 33.44 | 31.99 | 28.75 | 25.40 | 22.25 | 19.51 | 17.16 |
| ε=12.5% | 35.68 | 34.98 | 33.74 | 32.58 | 31.19 | 29.83 | 26.81 | 23.68 | 20.75 | 18.19 | 16.00 |
| ε=15% | 33.10 | 32.45 | 31.29 | 30.22 | 28.93 | 27.67 | 24.87 | 21.97 | 19.25 | 16.87 | 14.84 |
| ε=20% | 27.93 | 27.38 | 26.41 | 25.51 | 24.41 | 23.35 | 20.99 | 18.54 | 16.24 | 14.24 | 12.53 |
| rsg ∞exp | m=2.5 σ=1.5 | m=3 σ=1.5 | m=3.5 σ=1.8 | m=4 σ=2 | m=4.5 σ=2.3 | m=5 σ=2.5 | m=6 σ=3 | m=7 σ=3.5 | m=8 σ=4 | m=9 σ=4.5 | m=10 σ=5 |
|---|---|---|---|---|---|---|---|---|---|---|---|
| ε=3% | 51.44 | 49.86 | 47.06 | 44.73 | 42.13 | 39.97 | 35.52 | 31.21 | 27.31 | 23.92 | 21.00 |
| ε=4% | 50.58 | 49.02 | 46.27 | 43.98 | 41.42 | 39.30 | 34.92 | 30.68 | 26.85 | 23.52 | 20.65 |
| ε=5% | 49.71 | 48.18 | 45.48 | 43.22 | 40.71 | 38.63 | 34.33 | 30.16 | 26.39 | 23.11 | 20.30 |
| ε=7% | 47.98 | 46.51 | 43.90 | 41.72 | 39.29 | 37.29 | 33.13 | 29.11 | 25.48 | 22.31 | 19.59 |
| ε=10% | 45.39 | 43.99 | 41.52 | 39.47 | 37.17 | 35.27 | 31.34 | 27.53 | 24.10 | 21.10 | 18.53 |
| ε=12.5% | 43.23 | 41.90 | 39.55 | 37.59 | 35.40 | 33.59 | 29.85 | 26.22 | 22.95 | 20.10 | 17.65 |
| ε=15% | 41.07 | 39.80 | 37.57 | 35.71 | 33.63 | 31.91 | 28.36 | 24.91 | 21.80 | 19.09 | 16.77 |
| ε=20% | 36.74 | 35.61 | 33.61 | 31.95 | 30.09 | 28.55 | 25.37 | 22.29 | 19.51 | 17.08 | 15.00 |
From the data above I came to the conclusion that the skill level required for a ranked player to save enough time to make saving blaze bed for zero worth it average wise is not very high, while for rsg it is slightly higher in most cases, though a lot lower than it actually should be due to the addition of max perches in ranked.
The results above are not exactly accurate, the low sample size of open spawner blaze bed, end spawns, dragon target node, the rough estimation of the player skill level, the sloppy data of average zero cycles and one cycles can all affect the results in different ways, but it is probably not enough to change the conclusion that saving blaze bed for zero cycle is better for any intermediate player and above in ranked. The results about rsg however doesn’t really apply well to real run conditions, since you would just reset any 2+ minute perch at a higher level, so take it with a grain of salt. I am no statistic expert, so if there is any statistic related basic mistakes, please point them out. I was originally planning on working on all the cases where how much you are ahead/behind in a ranked game or how much do you want to high roll in rsg, but that turned out to be a huge amount of work, and it will probably come out another day.
Most of the data used are in this very messy spreadsheet:
link
25/10/21 Edit 1: Changed the fly away odds from integer distribution to real number distribution and all affected data; corrected the typo in the formula used for estimating player skill from Φ((x - m) * σ) to Φ((x - m) / σ); fixed an important bug in the sheet that made the fly away odds of back & 1/8 dragon always used data from ranked even when the toggle is set to rsg, which makes the conclusion change from ranked requiring more skill to save time all of the time to only some of the time; though, the note that the results about rsg doesn’t really apply well to real run condition stays the same.
25/10/21 Edit 2: Filled in the table for time saved on zero with 5 explosives for different runner skill levels.
25/10/22 Edit: Added table for average time save on zero cycles with enough explosives; Clarified how player always chooses the setup with highest odds of hitting, considering both skill and fly away odds.
25/10/22 Edit 2: Further clarified that the tables showing players saving time on zeroes are the times saved on average.
25/10/22 Edit 3: Swapped the example for a ranked player to save more than 21.5s in the conclusion.
25/10/28 Edit 1: Fixed the mistake that I made using the avalible % in the blaze practice map directly as real spawn %. There turned out to be an 8.64% chance the spawner itself blocks the spawns and is not included by the map; Updated open blaze bed data with larger sample size; Updated the parameter that was used to estimate the probability dropped by a blaze in the same cycle blocking off space with more simulations. The change is pretty subtle, but it does make the skill level required for the player to save time on zero go up a sizable amount.
Note: I feel like I kind of overestimated ‘intermediate’ players’ skill level, some people die soooo much on zero, well over 15%. I will do more investigation on this later.
25/10/28 Edit 2: Removed the outdated borderline skill level table because the average time saved blaze bedding has been corrected. I think with the examples table for typical players’ time save zeroing over one cycling on average, the borderline skill level becomes pretty optional and is not really worth updating.
26/01/19 Edit: Updated incorrect results affected by 1/8 nodes being at y = max(73, terrain height + 6). 7/8 nodes are not affected as none of the 100 terrain heights collected for that are below y57; updated incorrect results affected by using the median end fight time in the T_Wagz video as mean end fight time, I can’t find the exact data anywhere else so I extracted the curve shown in the video and it actually showed that the mean end fight time was 2:05; updated results for ranked forced perch time to 2:25 and forced end fight time to 25 seconds after that, resulting in 170 seconds.