Bastion Route Success Rate Simulator

Hey there!

I was curious about trade rates, chest rates and success rates of various bastion routes (e.g. stables double triple vs triple to gap), so I made a small website to simulate bastion runs and determine a success rate based on some user-set minimum requirements.

I think this might be useful for comparing routes, testing the viability of new routes or checking if getting backup blocks is worth it. Each bastion has some presets that select the gold block and chest count for different routes, note that these may be different from how you do a route. Since I’m somewhat new to MCSR some of these might not be great default values so I’m open to any feedback.

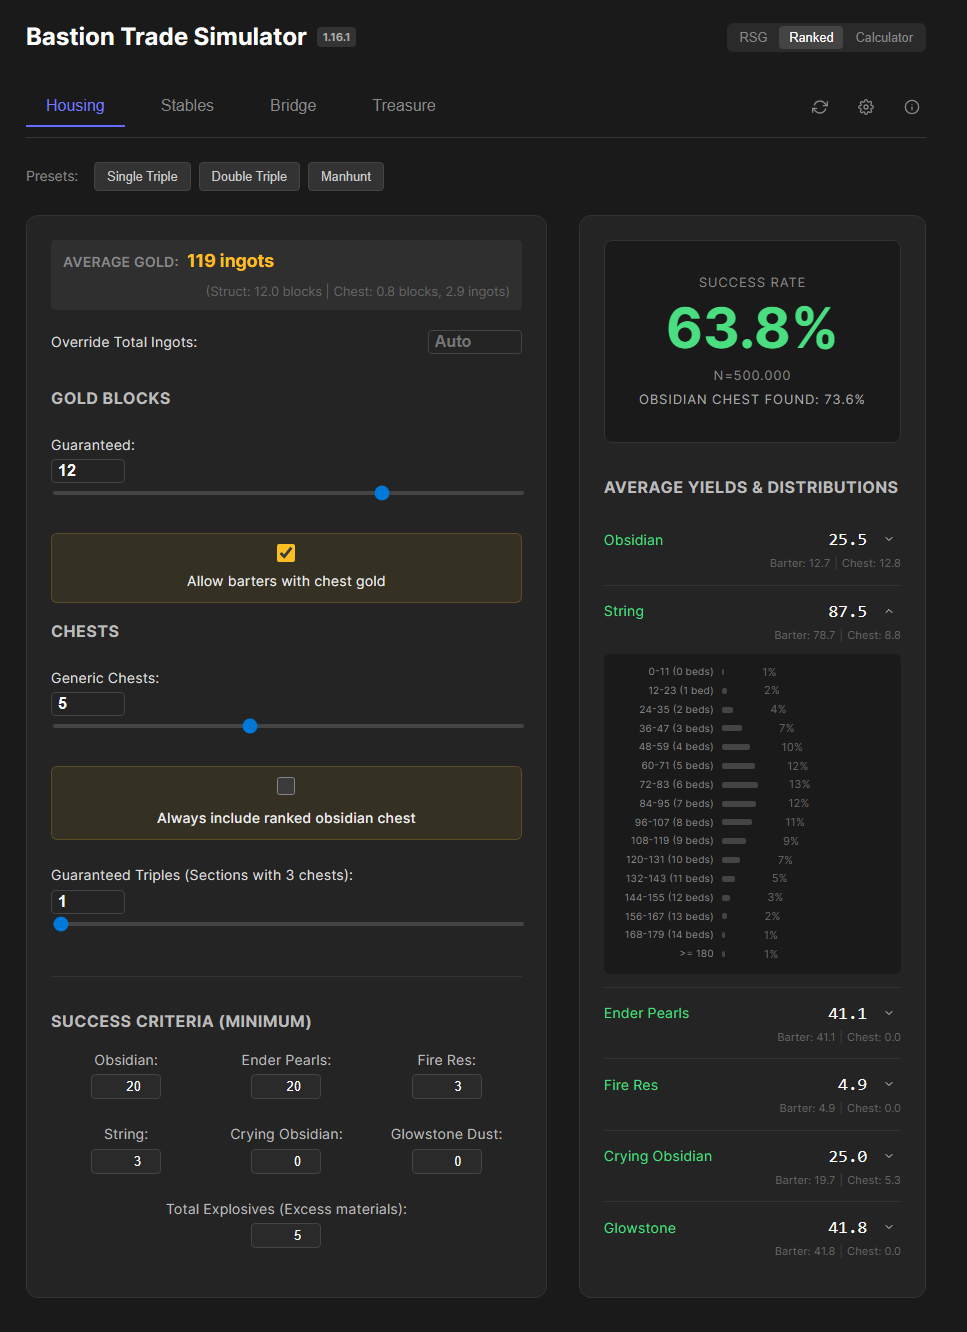
To demonstrate how this website can be used I’ll show some of the experiments I tested. For my experiments I ran 500,000 simulations with ranked RNG and used 20 obsidian, 20 ender pearls, 3 fire res, 3 string and 5 explosives of any kind as the minimum requirements. Although a lot of players can do with less, this is what I would call a comfortable bastion leave at my skill level.

On housing, looting a double triple over a single triple increases the success rates from 63.8% to 81.5%, if you don’t loot the double chest at the bottom, the odds go down to 38.0% and 71.1% respectively (so looting the double chest makes a pretty big impact).

On stables, triple to gap (with both backups) has a 61.4% success rate, double triple only has a 30.3% success rate, and triple triple goes all the way to 84.1% success rate! It’s also interesting to see how much the ranked RNG actually helps, when simulating the stables routes on RSG rules, the routes go down to 27.2%, 12.3% and 58.2% respectively.

On bridge, the difference between ranked and RSG is even clearer since there is so much gold to trade. When looting a single triple on bridge, the success rate goes from 79.2% on ranked down to 33.7% on RSG.

On treasure, the default route gives around 62.4% success rate, to raise it to 95% you would need to get around 5 gold blocks and the treasure chest from bottom treasure!

The site also lets you see distributions for each of the items as well as an average yield, you can also test this out in the separate calculator tab if you just want to see those for some specified amount of gold trades or chests. It’s pretty fun to watch the distributions update live by lowering the update size in the simulation settings :stuck_out_tongue:

Feel free to try out the site and let me know if you have any questions, suggestions or cool experiments to share; I think it would be nice to test on actual bare minimum requirements and seeing how much those improve the odds but I dont feel qualified enough to make any experiments for these (as my bare minimums are probably worse than better players :sob:).

I have some other ideas for tools I want to try to make so hopefully I’ll be able to show those soon…

5 Likes

Hey, thank you for making this, very cool tool.

I am a bit curious where you’re getting your numbers from. For example the assumed 0.7 gold blocks from generic stables chests seems to be high, which causes some doubts.

Furthermore your ranked trade results seem to be inconsistent with the data found here, so I’m a bit hesitant to trust the results on your site as I don’t know where the discrepancies lie.


Assuming the numbers are correct, an interesting addition could be to add success probability after assumed chest loot. e.g. I find 9 obby and a gold block in my first Stables triple, what is my success rate of double triple now? This can currently somewhat be done in a roundabout way, but would be nice to be able to easily add assumptions for comparison.

It would also be nice to have a breakdown of or otherwise overviewable way to see what criteria is responsible for what portion of the failure rate. e.g. I have an 88.5% success rate in Bridge Single Triple with a success criteria of 20 obsidian. The average yield table shows a 9% chance to roll less than 20% Obsidian, so this 9% could be represented in a red number without having to expand the yield table or in a separate failure rate breakdown table.

It could also be compared to the failure rate of the other criteria, assuming 7% to not hit enough Explosives and 1% to not hit enough Fire Res, you could show a table or pie chart representing Obsidian at 52.9% of the failure rate, Explosives 41.2% and Fire Res 5.9%.

Thank you for all the suggestions these are very good; It seems you are right to be worried about the ranked bartering chances based on that discord post, based on a 100.000 barter simulation of my logic I get

Obsidian: 11.13300000%
Leather: 9.24900000%
Crying Obsidian: 9.21300000%
Soul Sand: 9.16800000%
Fire Charge: 9.09900000%
Gravel: 9.06600000%
Nether Brick: 9.04500000%
Ender Pearl: 5.92500000%
Nether Quartz: 4.59800000%
String: 4.56100000%
Glowstone Dust: 4.53900000%
Magma Cream: 4.53400000%
Splash Fire Res: 2.29000000%
Fire Res Potion: 2.28700000%
Iron Nugget: 2.23200000%
Soul Speed Iron: 1.91300000%
Soul Speed Book: 1.14800000%

Since im unfamiliar with more details regarding how MCSR Ranked actually does barters I assumed they used negative sampling on the vanilla 1.16 loot tables (which i got from https://minecraft.fandom.com/wiki/Bartering/Outdated_loot_tables_in_Java_Edition). Currently my simulation runs cycles of 72 barters until it finds one that contains 6 obsidian and 3 ender pearl trades and then cuts it off based on how much gold was actually used; It seems this approach is not quite what they use though and I have considered other approaches but I thought they seemed less realistic and gave much different distributions. It seems I’ll have to take a closer look at some variations or see if I can find more info on how ranked actually does it. If you have any more info about the inner workings of the ranked bartering feel free to let me know…

As for the hoglin stable chest (and others) I use these loot tables (https://minecraft.wiki/w/Bastion_Remnant/Outdated_loot_tables_in_Java_Edition) to generate the chest loot the same way minecraft does it according to the wiki, for the stables example it rolls once from the first pool where it has a 25/105 chance to pull the gold blocks; then it uniformly chooses to put in 2, 3 or 4 of them, after this it pulls 3 or 4 times from the other pool. This gives a 23.8% chance at an expected value of 3 gold blocks (all these choices are simulated though), giving around 0.71 expected gold blocks from a stables chest.

Once I figure out how the ranked bartering actually works I’ll take a look at your other suggestions!

If you have any more info about the inner workings of the ranked bartering feel free to let me know

Past what’s in that linked discord message I really have no clue, but you could maybe try hitting up Char321 (who made the barter site in the message) on discord, or otherwise ask around the #public-help channel to see if someone could point you in the right direction.

As for the hoglin stables

Didn’t know about that wiki page existing, I’ve been looking at this 1.16.1 dated revision which gives a lower chance for gold blocks, but I have no clue which one is actually correct.

I have now updated the website to use the same algorithm char uses for their RNG website (which was confirmed by RedLime to be what they use). Unfortunately this changes a lot of the numbers of my original post but a lot of the principles still apply.

Note that the discord post you linked got their numbers by averaging 500 barters across 40 seeds; Since the bartering algorithm doesnt actually use negative sampling but rather forces obsidian and pearl trades in certain slots and then rerolls others, it is quite front loaded, meaning the average obsidian for say 100 trades is higher than for 144 (multiple of 72).

The obsidian odds I got with char’s code are about 12.66% but it does regularly go up to 13% if you are trading non multiples of 72.

Regardless, thank you for letting me know of this error! The code should be much more accurate now with regards to ranked bartering! I’ll have a look at your other suggestions when I have more time.

1 Like

I’ve had the idea of making something similar for a while and I’m really glad that you made it, if I were to make it there will probably be no GUI and require hours of code reading to make it work.

I do have a few ideas that I would like to see be implemented to make the tool be able to do more than it can now:

  • For ranked, if you don’t get enough trades, you can’t just reset, instead you either pivot to another route/get backups or just have to deal with the resources you have. So instead of measuring the success rate, we should probably measure the average time loss (configurable based on skill level) based on the resources traded / calculate the win rate based on the time gain/loss distribution. For example, if we have 4 explosives, that can be a 40s time loss compared to 5 explosives, or 60s time loss compared to 6 explosives.
  • Sometimes you can’t really know ahead of time which chests you will be able to get. For example, if you did a gap route in a buried stables, at the time you make that decision you won’t know how many chests you can get from the top. So maybe there can be an ‘unknown rampart’ option that has unknown amount of chests.
  • If you did manhunt boating down a housing, you might get enough obsidian that you never actually have to go top and save time. Maybe it can keep track of the time loss moving from one part of the bastion to the other & take in the time loss estimated leaving the bastion from a part of the bastion, and execute the optimal strategy in every simulation ran. This is obviously easier said than done but if we can make it a reality we can truely solve double triple vs triple to gap & top-down vs manhunt once and for all.